Ninety minutes of nothing:
the World Cup final through the order book.
Spain won the 2026 World Cup on July 19th. On Polymarket, the market called "Will Spain win on 2026-07-19?" resolved No.
Both of those are true. The final finished 0–0 after ninety minutes, Spain went on to win in extra time, and the three-way match market settles on regulation — so the draw paid out on the night the trophy went to Spain. That quirk is worth knowing about. But the more interesting story is the one in between: a market that repriced 68 points while absolutely nothing happened.
Our previous note measured the opposite extreme — a single goal moving a market 64 points in 0.65 seconds. This is the control experiment. No goals, no red cards, no news of any kind for ninety minutes; just a clock running down. What the order book does in that situation turns out to be a better description of how these markets actually behave most of the time, and it exposes something the price chart and the spread both hide.
The market
The final's match event carried three markets — Spain win, Argentina win, draw. Across all six outcome tokens we recorded $14.6M in fills (44,714 trades) on the day, $6.3M of it in-play, and 378,066 top-of-book updates, 254,464 of them between kickoff and the final whistle. The World Cup series as a whole produced 4.86M book updates that day. Fees on every fill were zero.
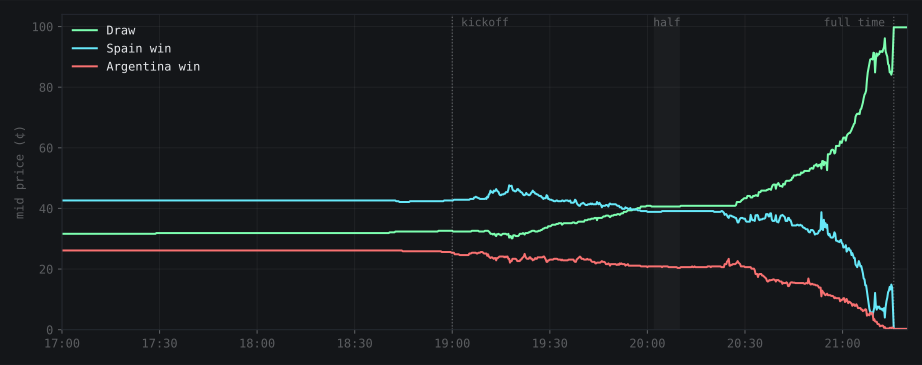
Pre-match, the book barely moved for eighteen hours. Spain sat at 42.25/42.5¢, Argentina at 26.5/26.75¢, the draw at 31.5/31.75¢ — each quoted a quarter-cent wide, essentially unchanged from midnight to the last few minutes before kickoff. The three asks summed to $1.0100, and that overround stayed inside 1.0025–1.0125 all day, through the entire match, including the chaos at the end. Whatever else was falling apart, the cross-market pricing relation held.
A 68-point move that nothing caused
The draw sat at 31.6¢ all day and settled at 99.75¢ — 68 points. Measured from the last quote before kickoff it is 32.6¢ → 99.75¢, while Spain went 42.6¢ → 0.25¢ and Argentina 25.4¢ → 0.25¢. In a normal match that magnitude of repricing arrives in one or two discontinuous jumps you can point at. Here there is nothing to point at, and the tick data proves it: the largest one-second move in the draw's mid price during the entire match was 8.9 points. Over any ten-second window, 10.0 points. Over any full minute, 15.1 points — and all three of those maxima land in the closing minutes, as the market converged on a result that had become arithmetically obvious.
Compare that to the same series nine days earlier: one goal, 64 points, 0.65 seconds. The entire ninety minutes of the final never produced a single second as violent as one ordinary goal. This is what a pure time-decay repricing looks like — and for the many prediction markets that resolve on a deadline rather than an event, it is the normal case, not the exception.
The liquidity left before the whistle
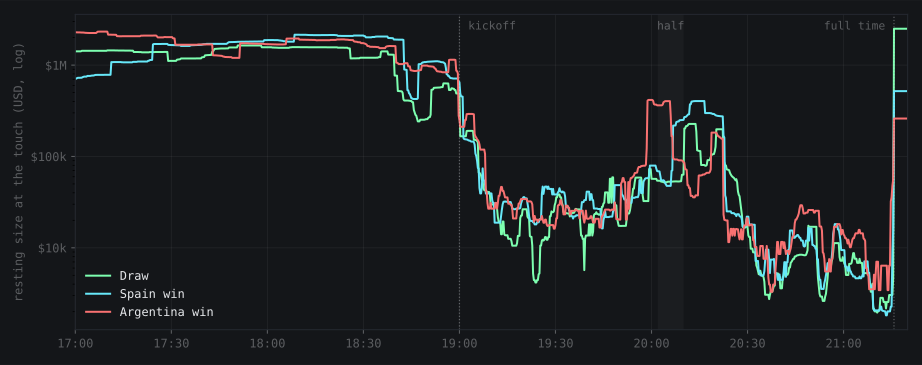
The depth tells a completely different story from the price. Summed across the three markets, resting size at the touch averaged 5.40M contracts between 18:00 and 18:30 — half an hour before kickoff. By the 18:30–19:00 window it was 3.25M. In the last five minutes before kickoff, 2.16M. In the first fifteen minutes of play, 285k. (Depth here is contract count, best bid + best ask; a contract pays $1 at resolution, so this is also the max-payout notional. The cash cost of lifting it is price-dependent and smaller.)
That is a 95% withdrawal, and most of it happened before a ball was kicked. Market makers did not react to the match starting; they were gone in advance of it, on a schedule. For anyone modelling execution, the implication is blunt: the liquidity you can see in a pre-match snapshot is not the liquidity you will trade against, and the decay begins while the market still looks completely calm.
The spread lied the whole time
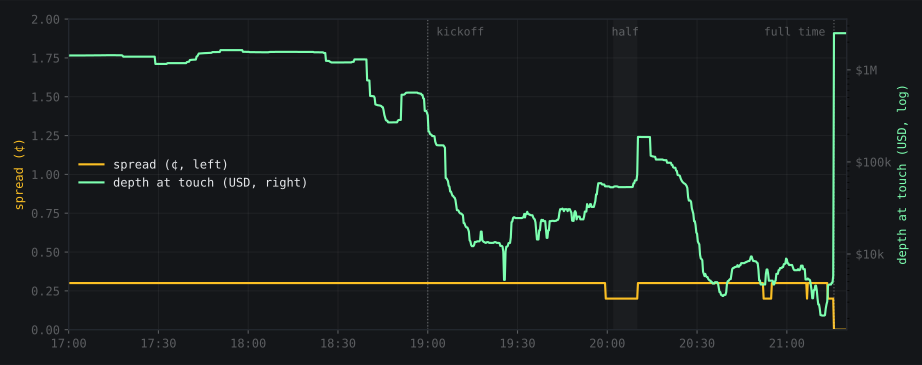
Here is the part that matters most, and the reason an order-book archive tells you things a price feed cannot. While depth fell by more than an order of magnitude, the time-weighted spread did not move at all:
| phase | market | tw spread | tw depth @ touch (contracts) | book updates |
|---|---|---|---|---|
| pre-match (00:00–19:00) | Spain | 0.25¢ | 1,509,900 | 16,340 |
| Argentina | 0.25¢ | 1,278,761 | 28,195 | |
| Draw | 0.25¢ | 1,319,057 | 14,050 | |
| first half | Spain | 0.26¢ | 51,167 | 17,031 |
| Argentina | 0.25¢ | 71,913 | 15,993 | |
| Draw | 0.25¢ | 48,450 | 11,842 | |
| second half | Spain | 0.28¢ | 83,959 | 23,143 |
| Argentina | 0.29¢ | 33,472 | 20,993 | |
| Draw | 0.27¢ | 47,834 | 20,686 |
Every spread in that table is between 0.25¢ and 0.29¢ — a single tick, essentially unchanged. If spread were your liquidity metric, you would conclude the market was identical before and during the final. It was not: the same quarter-cent quote was backed by 1.3M contracts pre-match and 48k in the second half — roughly a 28× difference in the size resting at the touch, with no visible change in what you were quoted.
If you trade — or backtest — these markets
- Spread is not a liquidity measure on Polymarket. It stayed at a single 0.25¢ tick while executable size fell 95%. Any cost model keyed on quoted spread will understate slippage by an order of magnitude exactly when it matters.
- Liquidity leaves on the clock, not on the news. Depth was already down 60% before kickoff. If you size from a pre-event snapshot, you are sizing against a book that will not be there.
- Deadline markets reprice smoothly. No move in this match exceeded 8.9 points in a second. Strategies built around latency and gap risk have little to feed on here; strategies built around carry and time decay have a lot.
- Read the resolution rules before you trust a label. "Will Spain win on 2026-07-19?" resolved No on the day Spain won the World Cup, because the market settles on regulation time. A backtest that joins market names to match results will silently mislabel every extra-time fixture in your sample.
Methodology & data
Source: TickFoundry's recording of Polymarket's market websocket (the live CLOB feed), normalized to L1 top-of-book updates and per-fill trades, each with a nanosecond receive timestamp from our collector. Times here are our receive times, not exchange matching times. "Mid" is (best bid + best ask)/2; depth here means resting size at the best bid plus the best ask — top of book only, counted in contracts, which is what L1 reports — and time-weighted figures weight each quote by its lifetime. Spreads are computed as best_ask − best_bid, not from the spread column (see the correction below). Volumes and the 378,066 / 254,464 update counts cover all six outcome tokens of the three markets; the phase table below them is per market, on the YES leg, which is why its update column sums to about half the headline figure. Table windows are pre-match 00:00–19:00, first half 19:00–20:02, second half 20:10–21:10. The halftime band is inferred from the quote-rate trough (20:02–20:10), not from an official match clock; kickoff at 19:00 and settlement at 21:15:44 are taken from the book's own activity. Event 708597, condition ids 0xdfbaae9f…, 0x0c9ea0b1…, 0x51166276… — the same slice, as parquet, is what we sell. Resolution outcomes are read from the settled markets themselves (regulation 0–0, extra time yes, penalty shootout no, Spain to advance).
Correction 2026-08-03: this note originally labeled the depth figures as USD; they are contract counts (equal to max-payout notional at $1 per contract, not cash cost). The values themselves and every finding are unchanged.
Correction 2026-08-05: the spread column of the phase table originally read 0.29¢–0.34¢. Those figures came from the L1 spread field, which is rounded to three decimal places and therefore cannot represent this venue's 0.25¢ tick — it reports 0.3¢ instead, about a 20% overstatement at the minimum tick. Recomputed as best_ask − best_bid the range is 0.25¢–0.29¢: flatter and tighter than first published, which strengthens the finding rather than weakening it. Second-half depth and update counts were also re-derived under the now-stated 20:10–21:10 window. The depth collapse, the 68-point move and every conclusion are unchanged. Fig 3's amber spread series still plots the rounded field and so sits ~0.05¢ high; it is a flat line either way, and will be regenerated.
Every number above comes from two parquet files anyone can load in pandas — the L1 book updates and the trades. Grab a free sample bundle to see the exact schema, or pull any market-day from the catalog.