Anatomy of a last-minute goal:
Spain–Belgium through the order book.
Spain beat Belgium 2–1 in Friday's World Cup quarterfinal, and until the 89th minute they were heading out of regulation tied. Then Mikel Merino scored, 117 seconds after coming on. On Polymarket, the "Will Spain win on 2026-07-10?" market repriced from 26¢ to 90¢ — a 64-point move, 80% of it inside 0.65 seconds.
Everyone can see that move in a price chart. What a price chart can't show is what happened inside the market while it moved: the spread blowing out to 31¢, the book at the touch thinning to ~$1.3k, and the first aggressive fill landing 35 milliseconds before the book itself had visibly repriced. Polymarket's order book runs off-chain, so none of this is in on-chain data. We record the live book feed — every quote, every level, every fill, with nanosecond receive timestamps. This note is what that data shows for one match.
The market
The main match event carried three markets — Spain win, Belgium win, draw. Measured on the YES leg of each (the three tokens this note follows throughout), we recorded $11.1M in fills (56,914 trades) on the day, $5.9M of it in-play, and 135,504 top-of-book updates in the 19:00–21:05 match window alone (the World Cup series as a whole produced 7.2M book updates that day). For open play the book was tight: time-weighted spread of 0.24¢ pre-match, 0.28¢ in the first half, 0.29¢ in the second. Prediction markets get called illiquid; a sub-0.3¢ spread on a coin-flip-priced contract is anything but — until news hits.
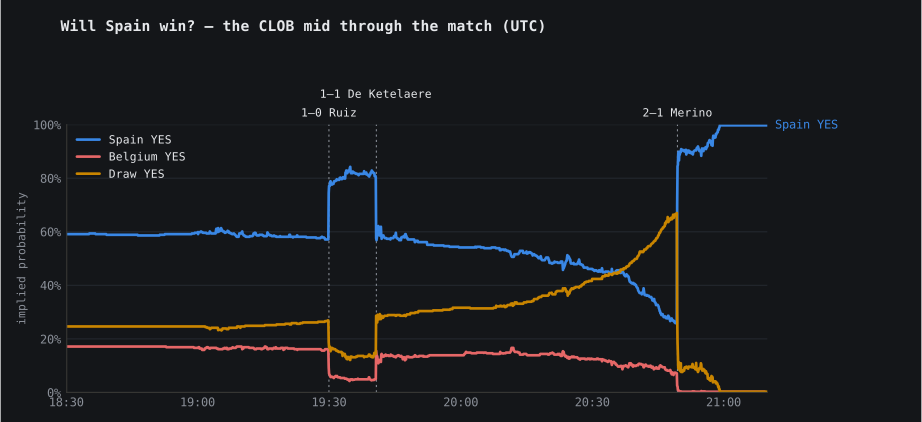
Three goals, three repricings
Each goal is a natural experiment: how fast does a prediction market absorb a discrete, unambiguous news shock? Measured from our receive clock, anchored on the first ≥3¢ move of the Spain-YES mid:
| goal | book time (UTC) | spain-yes mid | 80% repriced in | max spread | book-move → first print |
|---|---|---|---|---|---|
| 1–0 Fabián Ruiz | 19:29:53.256 | 58¢ → 78¢ | 1.20 s | 22¢ | +217 ms |
| 1–1 De Ketelaere | 19:40:42.989 | 83¢ → 57¢ | 0.39 s | 11.8¢ | +167 ms |
| 2–1 Mikel Merino | 20:49:29.258 | 26¢ → 90¢ | 0.65 s | 31¢ | −35 ms |
The last column is the interesting one. On the first two goals the pattern is what you'd expect: market makers pull and reprice their quotes, and the first aggressive fill at the new level prints ~200ms behind the book. On the winner, it inverts — the first ≥3¢-away fill lands 35ms before the book's own mid has moved 3¢. The fastest reaction to Merino's shot wasn't a maker pulling quotes; it was a taker lifting stale offers.
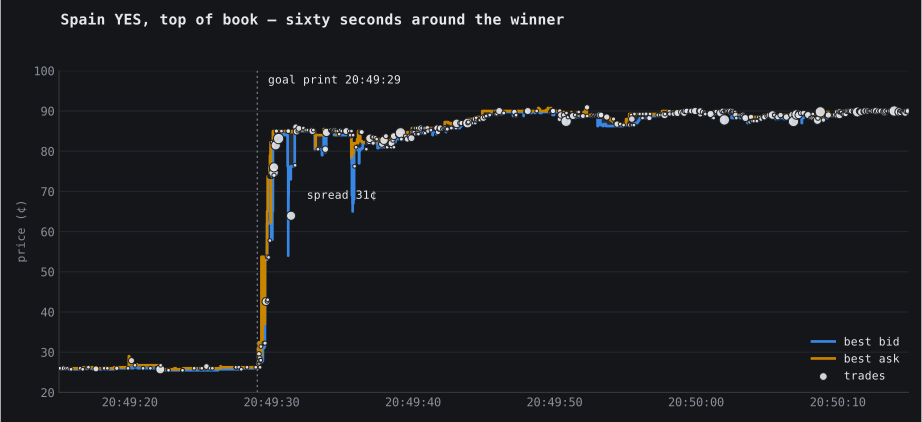
How much stale liquidity was actually there to take? Far less than the folklore suggests. In the three minutes from the first tick of the repricing, Spain-YES traded $752k across 1,728 fills — but only $1.6k of it, across nine fills, printed at 60¢ or below. The "free money" a fast trader could theoretically harvest from slow quotes was a handful of small fills that were gone within instants. Everything else printed at the new price. If your backtest assumes you could buy size at stale prices during goals, the tape disagrees — emphatically.
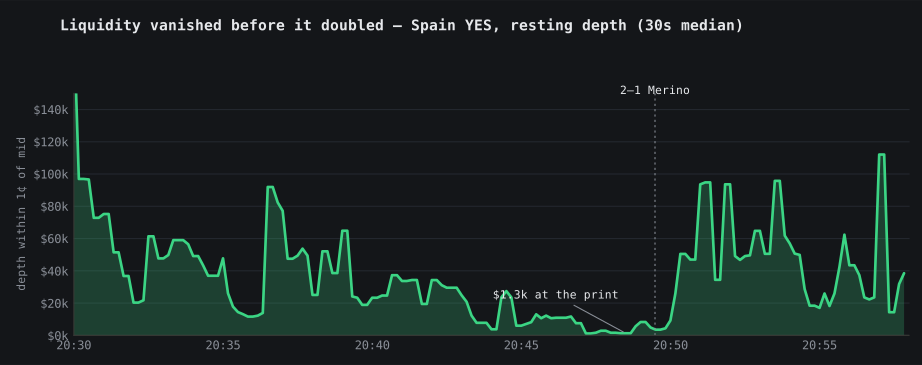
Liquidity saw it coming
The depth story is just as telling. Through the second half, resting size within 1¢ of the Spain-YES mid thinned into the goal — the 30-second median sat at $6.7k in the last half-minute before the print, down from six figures earlier in the half, makers de-risking a binary that any goal would gap. At the print itself the within-1¢ measure breaks down entirely: the spread blew past 2¢, so for stretches of the goal minute there was literally nothing within 1¢ of mid — $0. Measured at the touch instead (best bid + best ask, the metric our later notes use), the goal-minute median was ~$1.3k. Then, with the uncertainty resolved, liquidity came back bigger than the run-up: ~$40k median within 1¢ over the next ten minutes, with prints of resting depth above $200k.
If you trade — or backtest — these markets
- Touch-price fills are fiction during events. The book was ≤0.3¢ wide for 100+ minutes and 31¢ wide for the seconds that decided the P&L.
- Speed pays takers, not just makers. The first fill beat the visible repricing. But the pot for being fastest (~$1.6k at ≤60¢) is far smaller than it looks.
- Depth is regime-dependent. Sizing a strategy off average depth would overstate executable size ~25× at exactly the moments the strategy trades.
- Whales position early. The day's largest fills were pre-match: $183k of Belgium YES at 17¢ (18:25) and $162k of Spain YES at 59¢ (18:45) — not in-play punts.
Methodology & data
Source: TickFoundry's recording of Polymarket's market websocket (the live CLOB feed), normalized to L1 top-of-book updates, full 25-level L2 snapshots per update, and per-fill trades, each with a nanosecond receive timestamp from our collector. Times here are our receive times, not exchange matching times. "Mid" is (best bid + best ask)/2; depth is resting size within 1¢ of mid, both sides, in USD; time-weighted spread weights each quote by its lifetime. Volumes sum price×size per fill on the YES leg of each of the three match markets — the three tokens this note follows — and "in-play" means the 19:00–21:05 UTC match window. Event 676288, markets 2829164/66/67 — the same slice, as parquet, is what we sell.
Correction 2026-08-03: the depth passage originally read "drained from ~$60k to under $10k. At the print it touched $1.3k" — figures a re-derivation from the full L2 could not fully reproduce. The $1.3k was real but was depth at the touch in the goal minute, not within-1¢ (which was $0 whenever the spread exceeded 2¢ — the metric is blind exactly when the book is most stressed, which is why our later notes measure at the touch). The rewritten passage above carries the re-derived numbers.
Correction 2026-08-05: three further fixes from a full re-derivation against the shipping parquet. The headline move is 64 points (26¢ → 90¢), not the 62 originally printed. The volume and update counts were described as covering "six outcome tokens"; they are in fact the three YES legs, and the match window they use (19:00–21:05) is now stated — the figures themselves are unchanged and reproduce exactly. And the stale-liquidity passage originally read "$679k across 1,673 fills … only $13.5k at 60¢ or below"; re-derived over a stated three-minute window it is $752k across 1,728 fills, of which $1.6k printed at ≤60¢. The $13.5k could not be reproduced on any basis; the corrected, smaller figure strengthens rather than weakens the point.
Every number above comes from three parquet files anyone can load in pandas. Grab a free sample bundle to see the exact schema, or pull any market-day from the catalog. For the opposite extreme — a 68-point repricing with no goals at all — read note 002 on the final.