Polymarket's perps print half a second before Hyperliquid
Polymarket's perpetuals exchange has been in our capture since the end of July. It lists the same contracts Hyperliquid trades: BTC, ETH and SOL natively, and AAPL, NVDA, TSLA, gold, oil and the S&P through Hyperliquid's HIP-3 builder dexes. With both order books recorded side by side, the obvious question could be asked properly: when the same contract reprices on both venues, which one moves first?
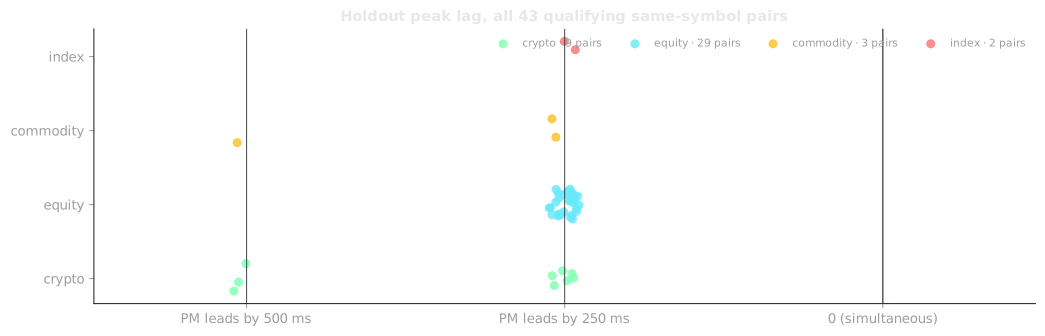
The answer, on the venues' own clocks, is Polymarket, and it is not close. Across 43 same-symbol pairs the peak of the return cross-correlation sits on the Polymarket-leading side in every single case: 39 pairs at 250 ms, four at 500 ms. The four half-second pairs are BTC, ETH, SOL and gold. The lag was chosen on the first four weeks and re-measured on the last two; 40 of the 43 pairs peak in exactly the same bin both times.
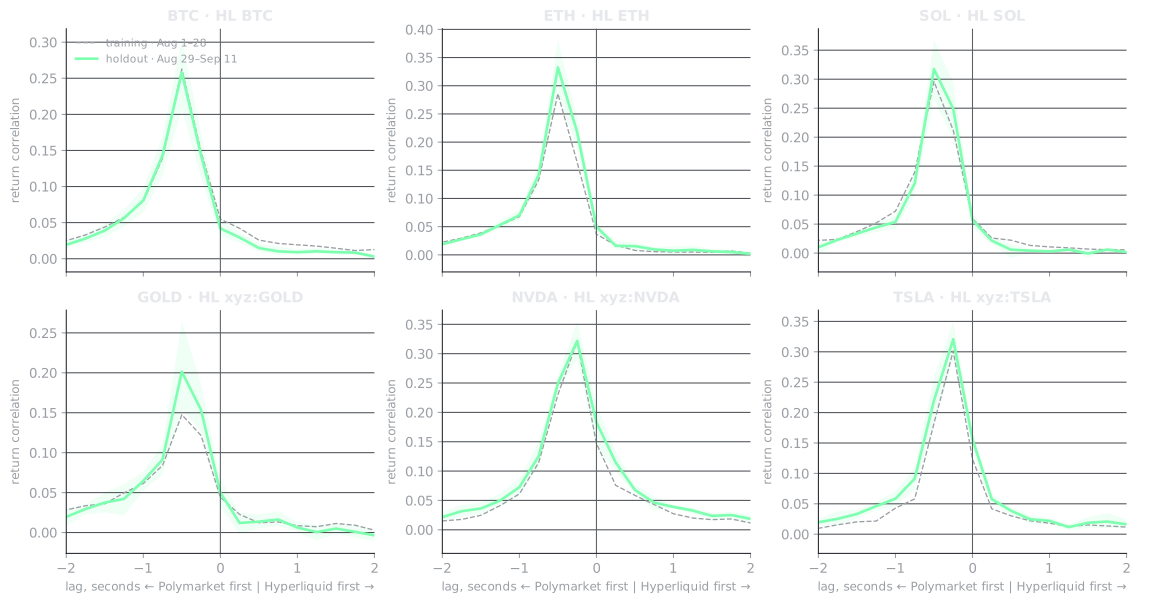
| Polymarket | Hyperliquid | holdout peak, PM leads by | correlation at that lag |
|---|---|---|---|
| BTC | BTC | 500 ms | 0.258 |
| ETH | ETH | 500 ms | 0.332 |
| SOL | SOL | 500 ms | 0.318 |
| GOLD | xyz:GOLD | 500 ms | 0.201 |
| NVDA | xyz:NVDA | 250 ms | 0.322 |
| TSLA | xyz:TSLA | 250 ms | 0.321 |
These six are a fixed diagnostic set chosen before the run, not the six best results. The other 37 pairs are in Fig 2 and in the full lag table. The pattern holds across asset classes: 29 equities, 9 crypto, 3 commodities and 2 indices (the S&P 500 and DRAM, as the venue's own dictionary classes them).
Does it predict anything it has not seen?
A correlation peak is suggestive. The stricter test is a forecast: fit a model on August, freeze it, and ask whether Polymarket's last half-second, second and five seconds of returns improve a prediction of Hyperliquid's next half-second beyond what Hyperliquid's own recent returns already give you. At that horizon, 35 of the 43 Polymarket-to-Hyperliquid models pass the study's joint screen on the holdout: they beat the own-history model, they beat "no price change", the day-level confidence interval is positive, and the result survives a conservative multiple-testing correction across all 452 comparisons. In the reverse direction, 4 of 43 pass. The relationship is not perfectly one-way, but it is very lopsided.
The universe run uses Hyperliquid books we reconstruct from the chain's order events. To make sure the result is not an artefact of reconstruction, six pairs were refitted from scratch on Hyperliquid's live websocket best bid and offer, which we also record. Same dates, same features, same eligibility rules:
| Hyperliquid target | R², own history only | R², adding Polymarket | Δ pp |
|---|---|---|---|
| BTC | 3.7% | 36.7% | +33.0 |
| ETH | 4.0% | 37.3% | +33.3 |
| SOL | 1.9% | 17.4% | +15.5 |
| xyz:GOLD | 2.8% | 18.3% | +15.4 |
| xyz:NVDA | 3.2% | 3.8% | +0.6 |
| xyz:TSLA | 1.3% | 1.7% | +0.4 |
R² here is squared-error improvement over a zero-return forecast on pooled holdout observations; it is not directional accuracy. For BTC and ETH, a third of the variance of the next half-second of Hyperliquid returns is explained by what Polymarket just did. For the two equities the improvement is real but small. The BTC, ETH and SOL websocket models beat the own-history model on every one of the 14 holdout days.
What a half-second lead is worth
Prediction skill and executable profit are different questions, and the second one is mostly about latency. The illustration below takes a fixed one-second signal (act when the frozen forecast exceeds twice its training standard deviation), crosses Hyperliquid's spread on entry and exit, and delays the entry by a set amount on the source clock:
| assumed entry delay | ETH, bps after spread | SOL, bps after spread |
|---|---|---|
| 0 ms | 1.86 | 1.25 |
| 250 ms | 0.95 | 0.26 |
| 500 ms | 0.28 | −0.39 |
| 1,000 ms | −0.14 | −0.86 |
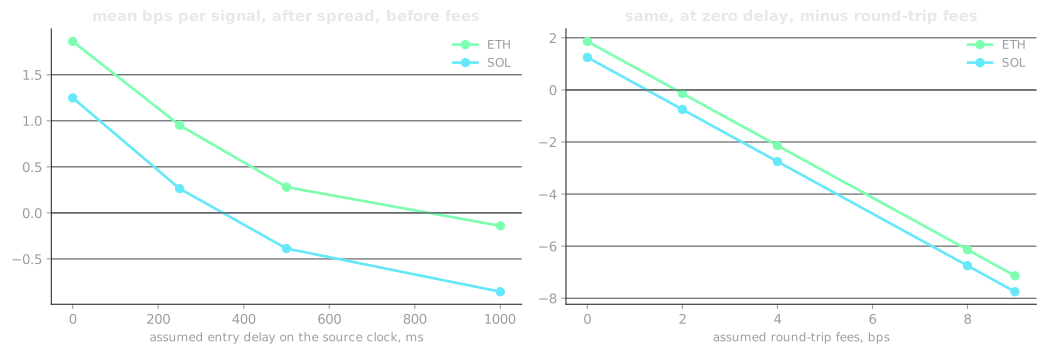
Read plainly: at zero delay the average signal is worth under two basis points after the spread, a 2 bps round-trip fee erases it, and every 250 ms of delay costs roughly half of what is left. A market maker on Hyperliquid who sees Polymarket first has something. A retail bot reading both public feeds from a laptop does not, and the note is not a claim that it does. Which is also why this is a data note rather than a strategy: the lead is measured, the latency budget is yours to measure, and the only way to do that is to record both feeds and your own acknowledgements against one local clock.
What "on source timestamps" means
Both clocks are the venues' own. Polymarket's is the emit time its server stamps on each websocket frame. Hyperliquid's is the block time, since its book is a state of the chain. Neither is our receive clock, and we deliberately did not use ours: the two feeds are recorded in different data centres, so a receive-clock comparison would measure our network as much as the venues. The consequence is that the lead is exactly what it says: the order in which the two venues stamp the same information. It is not a promise that the information is observable that early. A half-second offset between the two clock definitions would flip the sign of every pair, and the table records that.
Two more things we checked rather than assumed. Polymarket documents Hyperliquid as one possible input to its index price, so common inputs could produce predictability without one venue causing the other to move; the primary measurement uses traded quotes, not index or mark prices, and we do not have the historical feed weights, so the note makes no causal claim. And the reconstructed Hyperliquid books agree with the live socket at the touch about 99.2% of the time, but the rare disagreements are large enough to change squared-error fits, which is why BTC is not counted among the 35 successes on the reconstructed data even though it passes every day on the websocket data. That discrepancy is ours to fix and is documented in the results.
Coverage and what is excluded
Six weeks of overlapping capture: 42 complete UTC days from 2026-08-01, since 07-31 was a partial bring-up day. Of Polymarket's 83 instruments, 139 candidate pairs exist across Hyperliquid's native perps and its HIP-3 deployers, and 49 pairs on 48 instruments meet the history and book-quality bar; the 43 headline pairs are the same-symbol subset, after setting aside aliases such as NAS100 against USTECH and the GOOG/GOOGL share classes. Everything else is in the coverage table with the reason it was excluded. Quotes older than two seconds are censored, crossed or locked books invalidate the observation, and no state is carried across a UTC boundary. The 30-second forecast horizon did not have enough qualifying coverage, so the note claims nothing there.
It is one short regime. Six weeks of a two-month-old exchange is enough to measure a lag and test it out of sample; it is not enough to say the lag is permanent, and the venue's maker mix, fee tiers and index configuration can all change under it.
Reproducing it
The four result tables are served next to this page: lag_summary.csv, forecast_summary.csv, forecast_validation.csv and coverage.csv. The inputs are the same parquet we sell: Polymarket's event-driven perps_bbo table and Hyperliquid's hl_l1, both stamped with the source clocks above. Midquote log returns on a 250 ms previous-tick grid, Pearson correlation by lag with equal day weights, a linear forecast with the venue's own trailing 0.5 / 1 / 5-second returns as the baseline and the other venue's as the addition, two-day block bootstrap, Benjamini–Yekutieli across all 452 hypotheses. Everything ran in one pinned container; the method write-up is available on request while we decide how much of the pipeline to publish.